Reports
Doric generates every report instantly from your local books — no syncing, no waiting. Pick a date range, read it on screen, and export it to CSV or PDF when you need a copy.
Opening reports
Click the Reports icon in the left sidebar. Across the top you'll find a tab for each report. Switching tabs runs that report immediately for the current date range.
Choosing a date range
Most reports share a date range with quick presets — YTD, This Month, Last Month, and Last Year — or you can set a custom From and To date and click Apply. The range carries over as you switch between reports.
The Balance Sheet and Trial Balance are point-in-time reports, so instead of a range they take a single As of date.
The reports
Profit & Loss
Your income and expenses over the selected period, grouped by category. Use the account filter on the left to focus on specific categories, and toggle Hide $0 to drop categories with no activity.
Balance Sheet
What you own and owe as of a date: assets, liabilities, and equity. Sub-accounts roll up under their parents.
Trial Balance
Every account with a non-zero balance as of a date, shown as debits and credits — a quick way to confirm your books balance.
Income vs Expenses
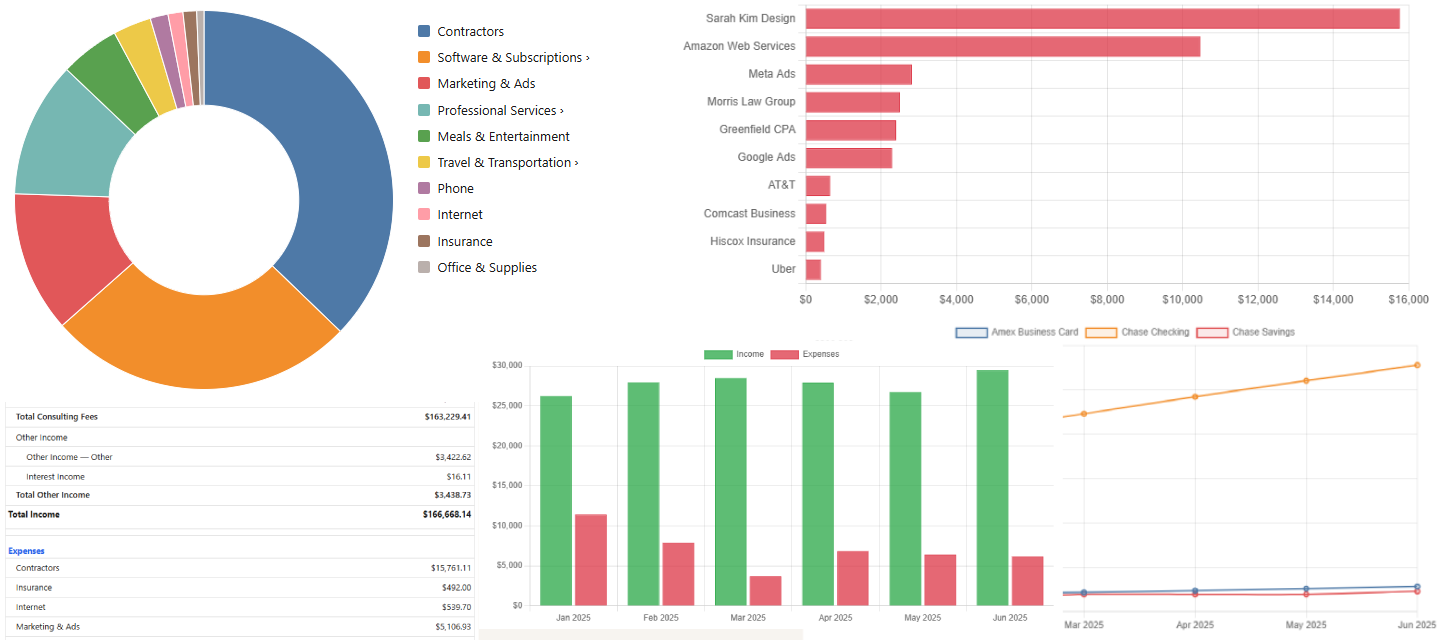
A bar chart comparing income against expenses over time. Switch the buckets between Month, Week, and Day. Click through to the register to see the transactions behind a period.
1099 / Payees
Totals paid to and received from payees you've marked as 1099-eligible — useful at tax time. Sort by payee, amount received, or amount paid.
Spending by Category
A pie chart of where your money goes, broken down by category. Click a slice to drill into its sub-categories; use the breadcrumb to step back out. Every category with activity in the period is shown — nothing is hidden behind a "top N" cap.
Spending by Payee
A ranked bar chart of your biggest payees. Switch between Expenses and Income, and choose how many to show — Top 10, 25, 50, a custom number, or All.
Account Balances
How your account balances move over time, bucketed by month, week, or day.
Saving a view
Set up a report the way you like it — date range and options — and save it from the panel on the right to reuse later. You can mark one saved view as the default so it loads automatically when you open Reports.
Exporting
Most reports offer Export CSV for opening the figures in a spreadsheet. And every report has an Export PDF button that produces a clean, printable document — ideal for sending to an accountant or filing away.
The PDF reflects exactly what you have on screen: the same date range, and the same choices like the Expenses/Income toggle or the Top-N limit on Spending by Payee. Wider reports such as Account Balances are exported in landscape automatically. Doric asks where to save the file, then shows an Open folder shortcut once it's written.